Dhaka Metropolitan Area
Forty-one metropolitan thanas measured from orbit: population, night light, surface heat, vegetation, land cover, air pollution, surface water and built-up growth, year by year, from the first Landsat epochs to the latest Sentinel pass.
Every value is a zonal statistic over the thana polygon, computed in Google Earth Engine from the source named on each chart. Nothing is modelled or interpolated by BDPolicyLab.
The city from orbit
Each image covers the same frame, 90.33–90.51 E and 23.67–23.90 N, so layers compare directly.
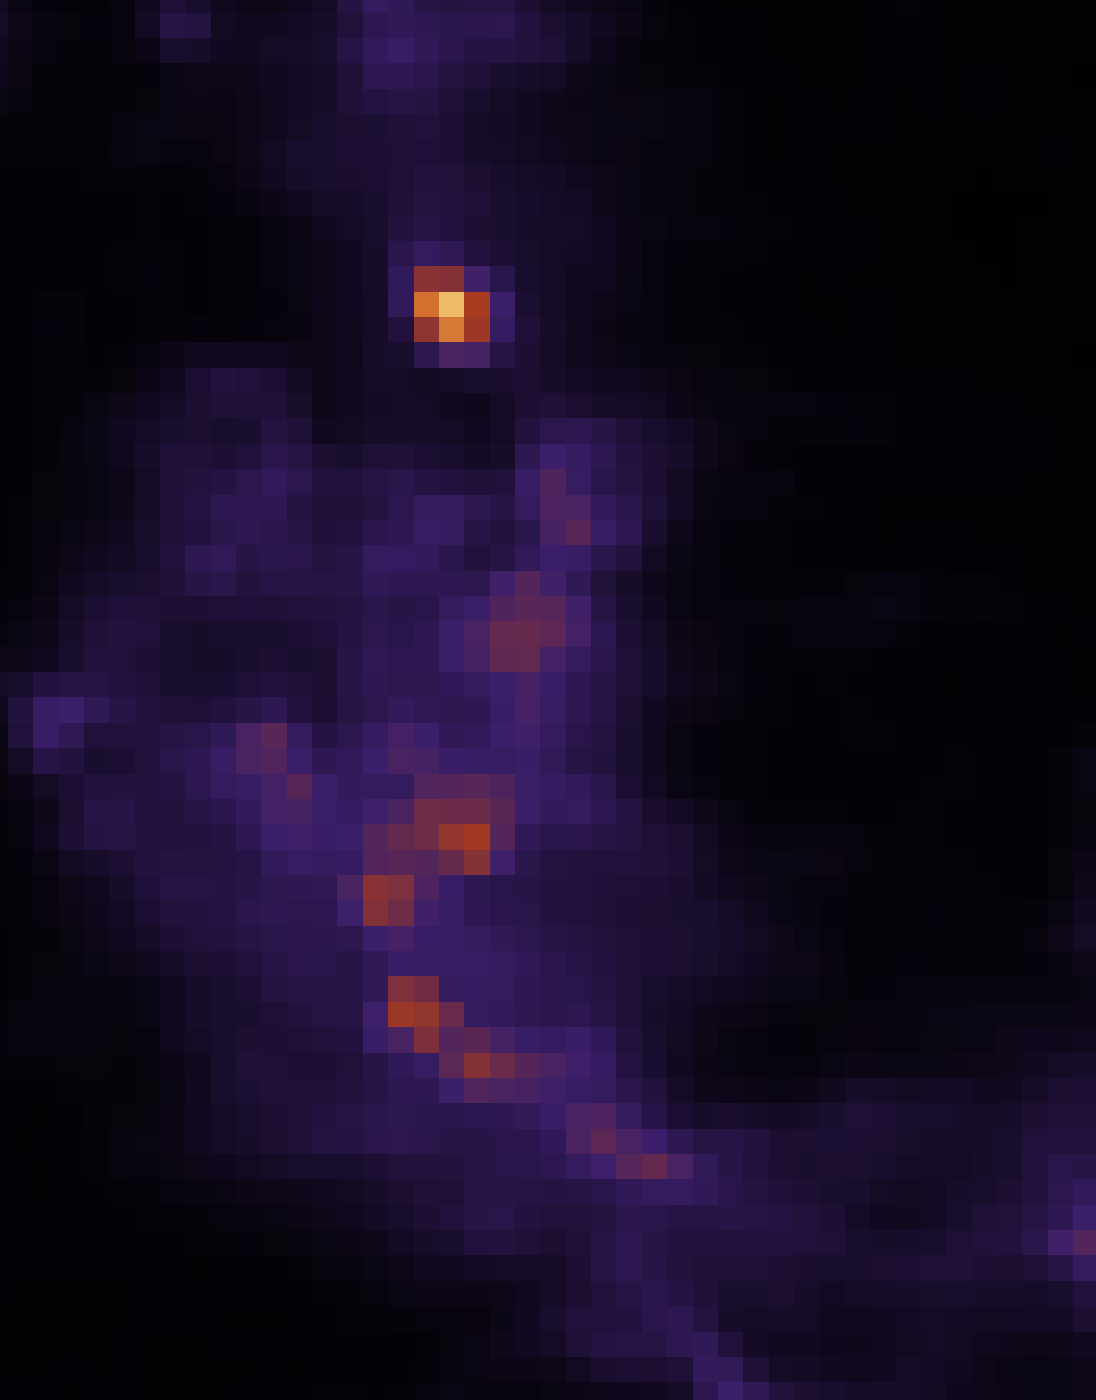
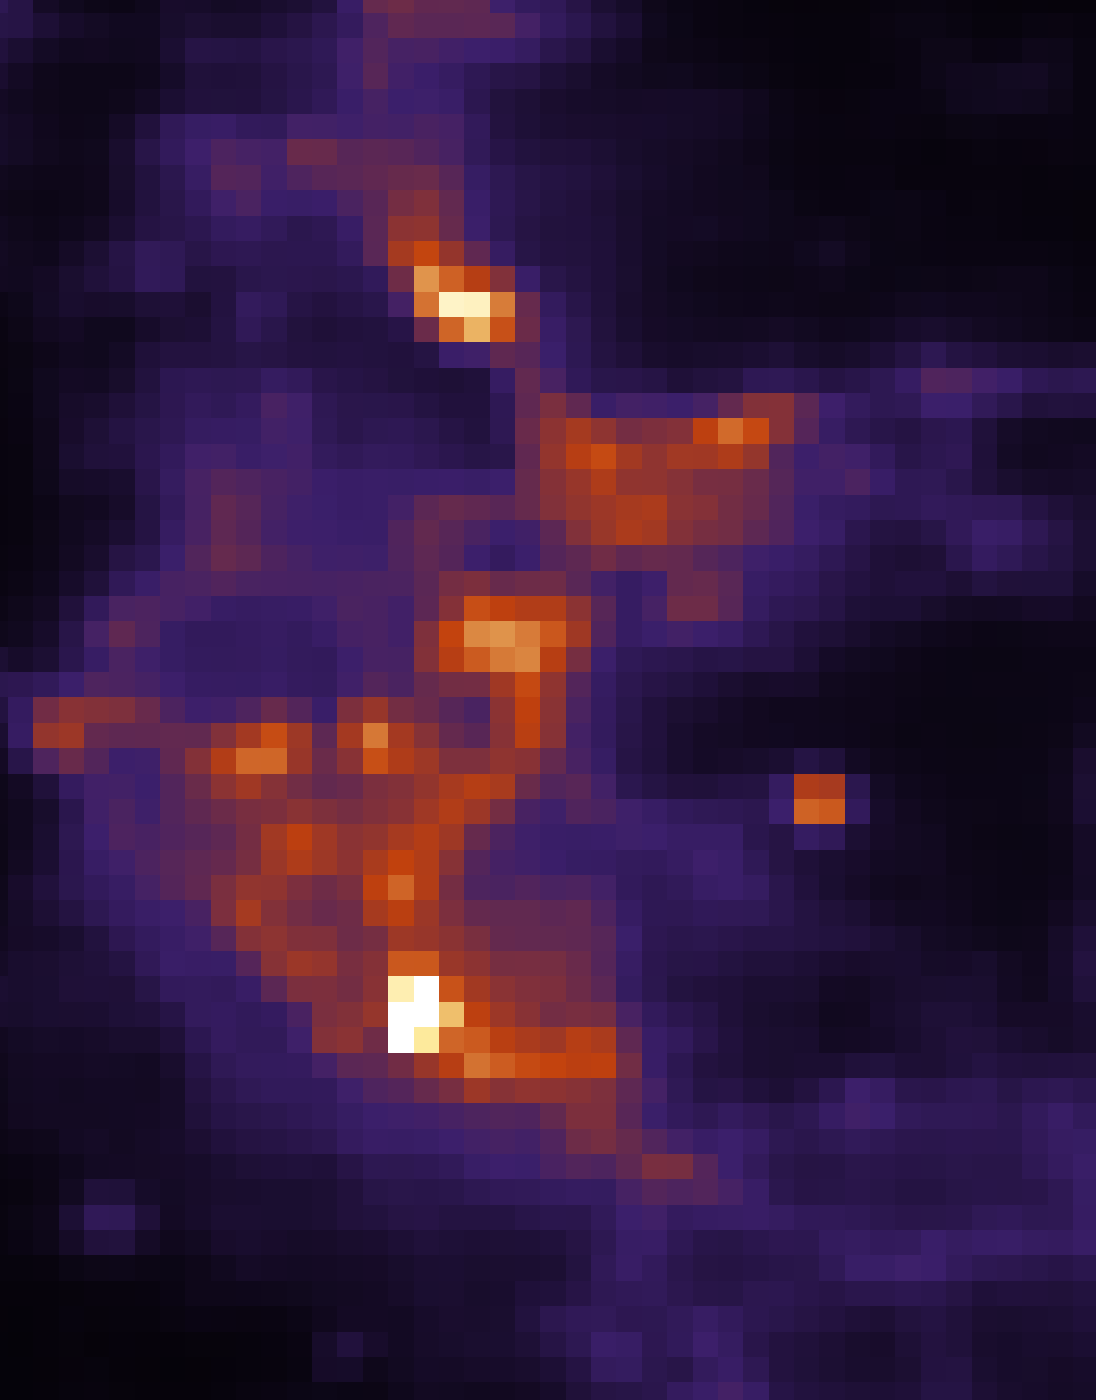
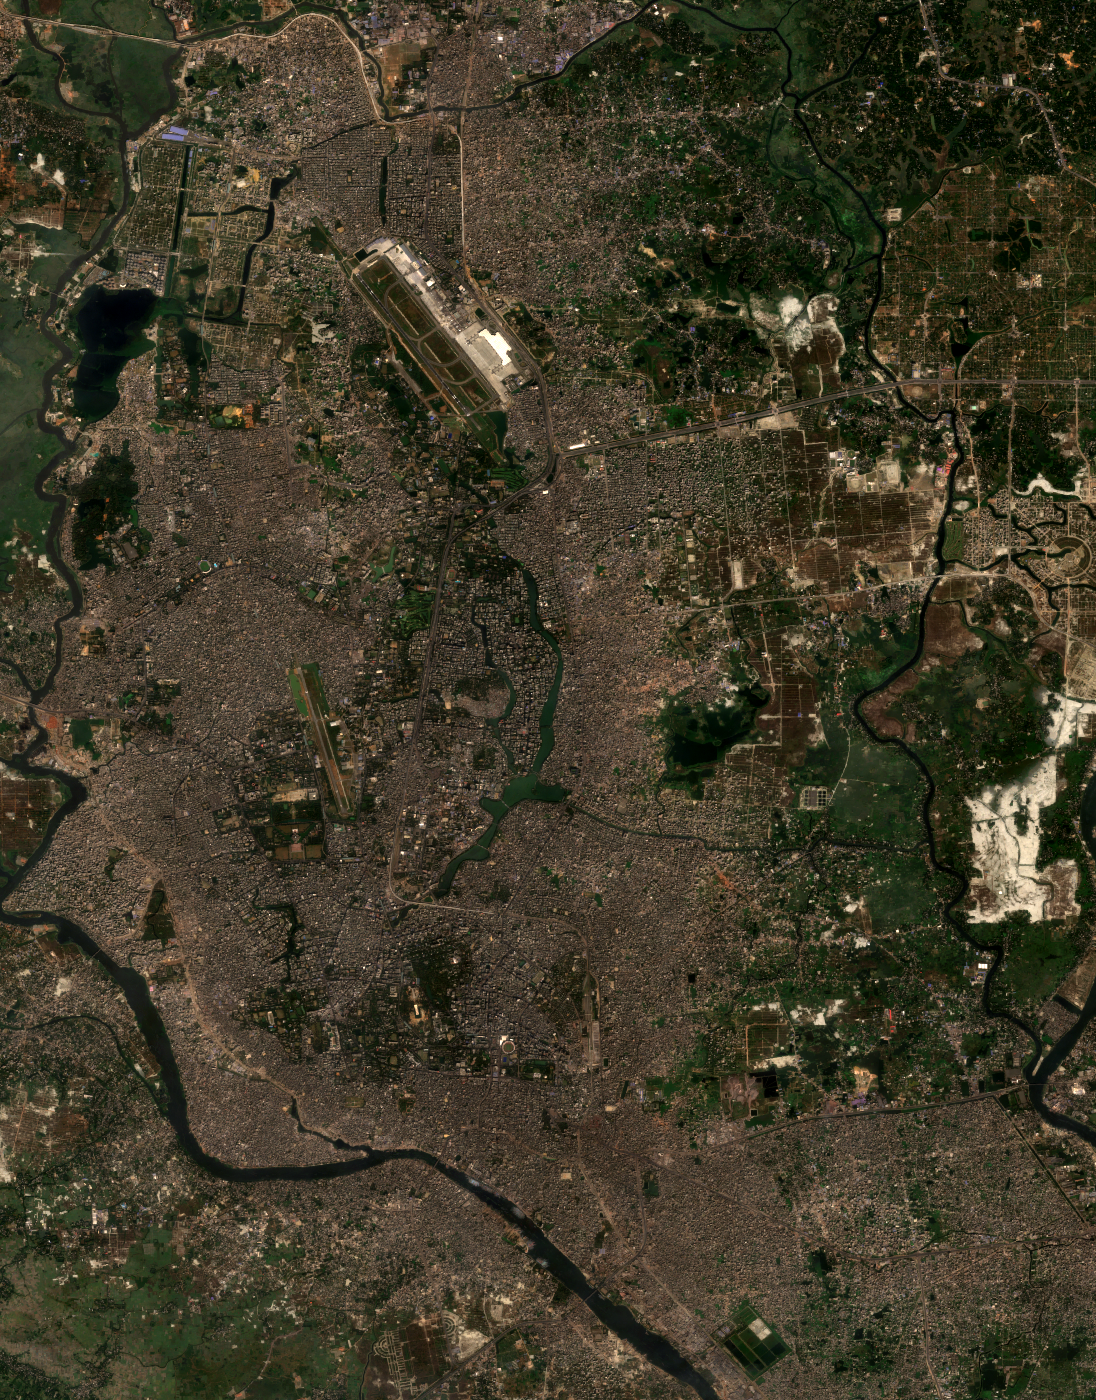
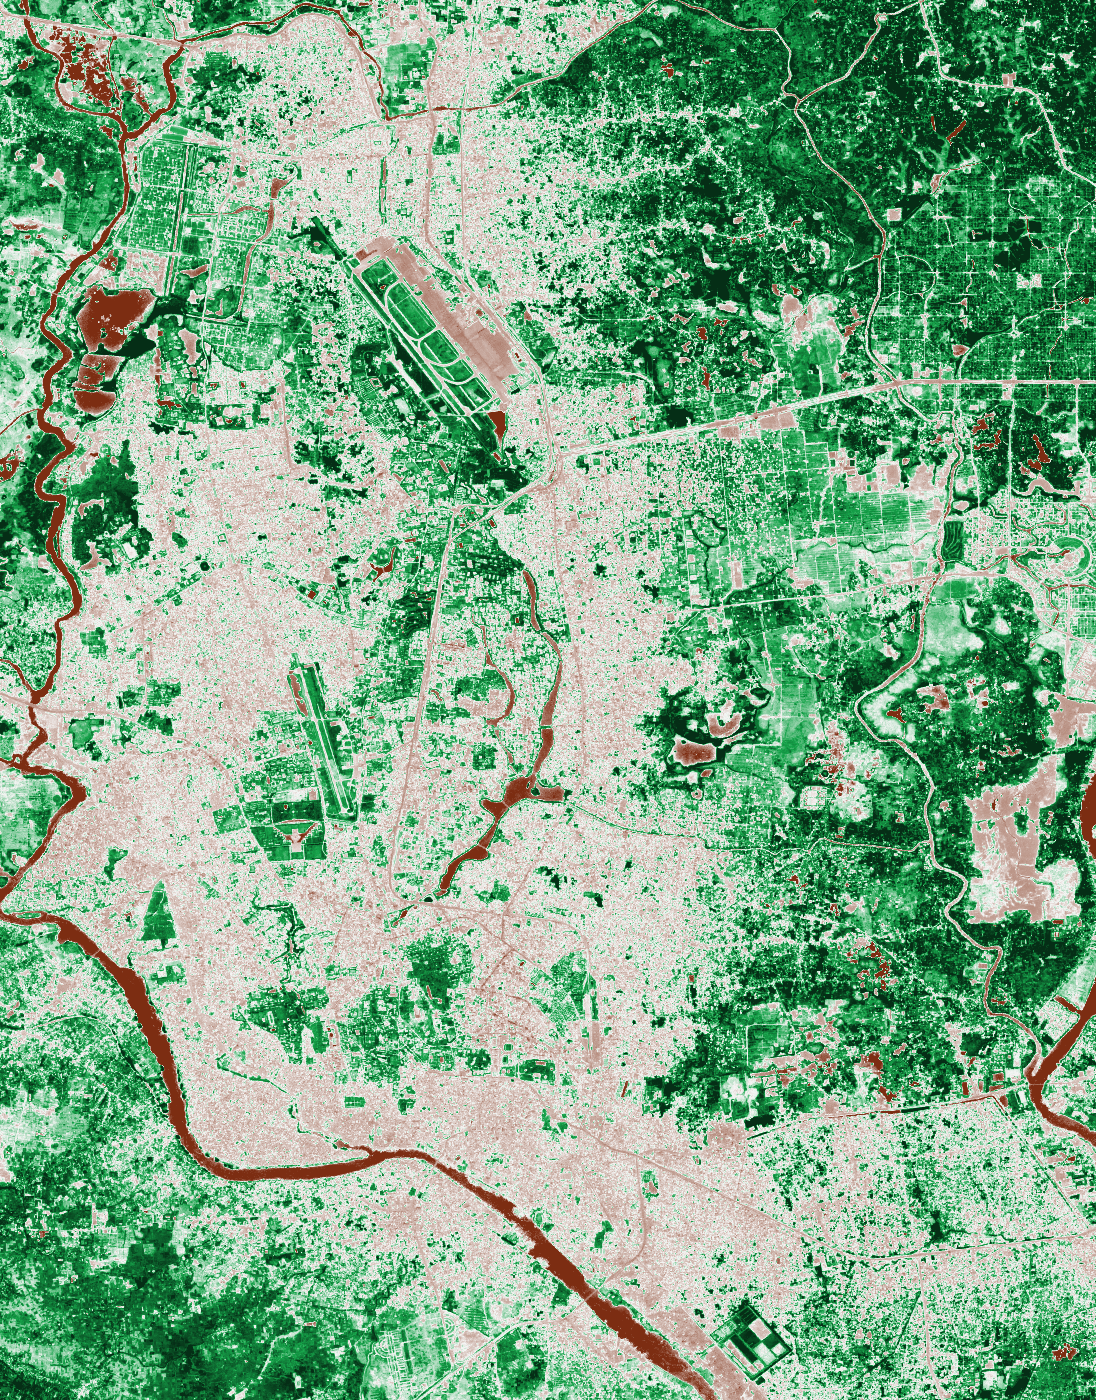
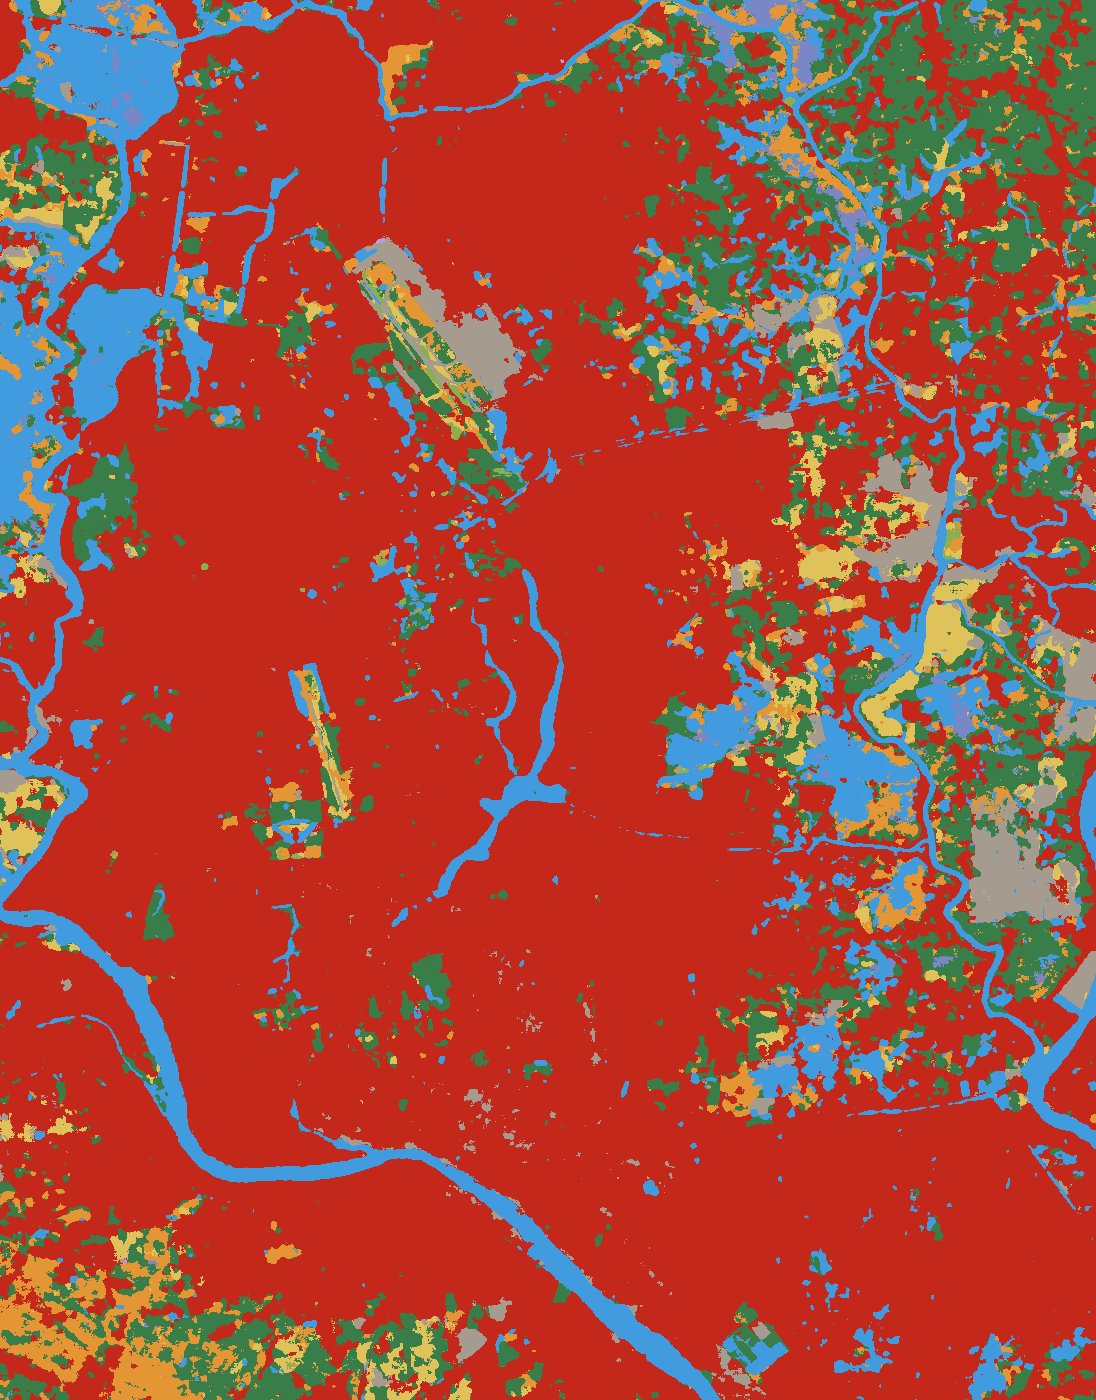
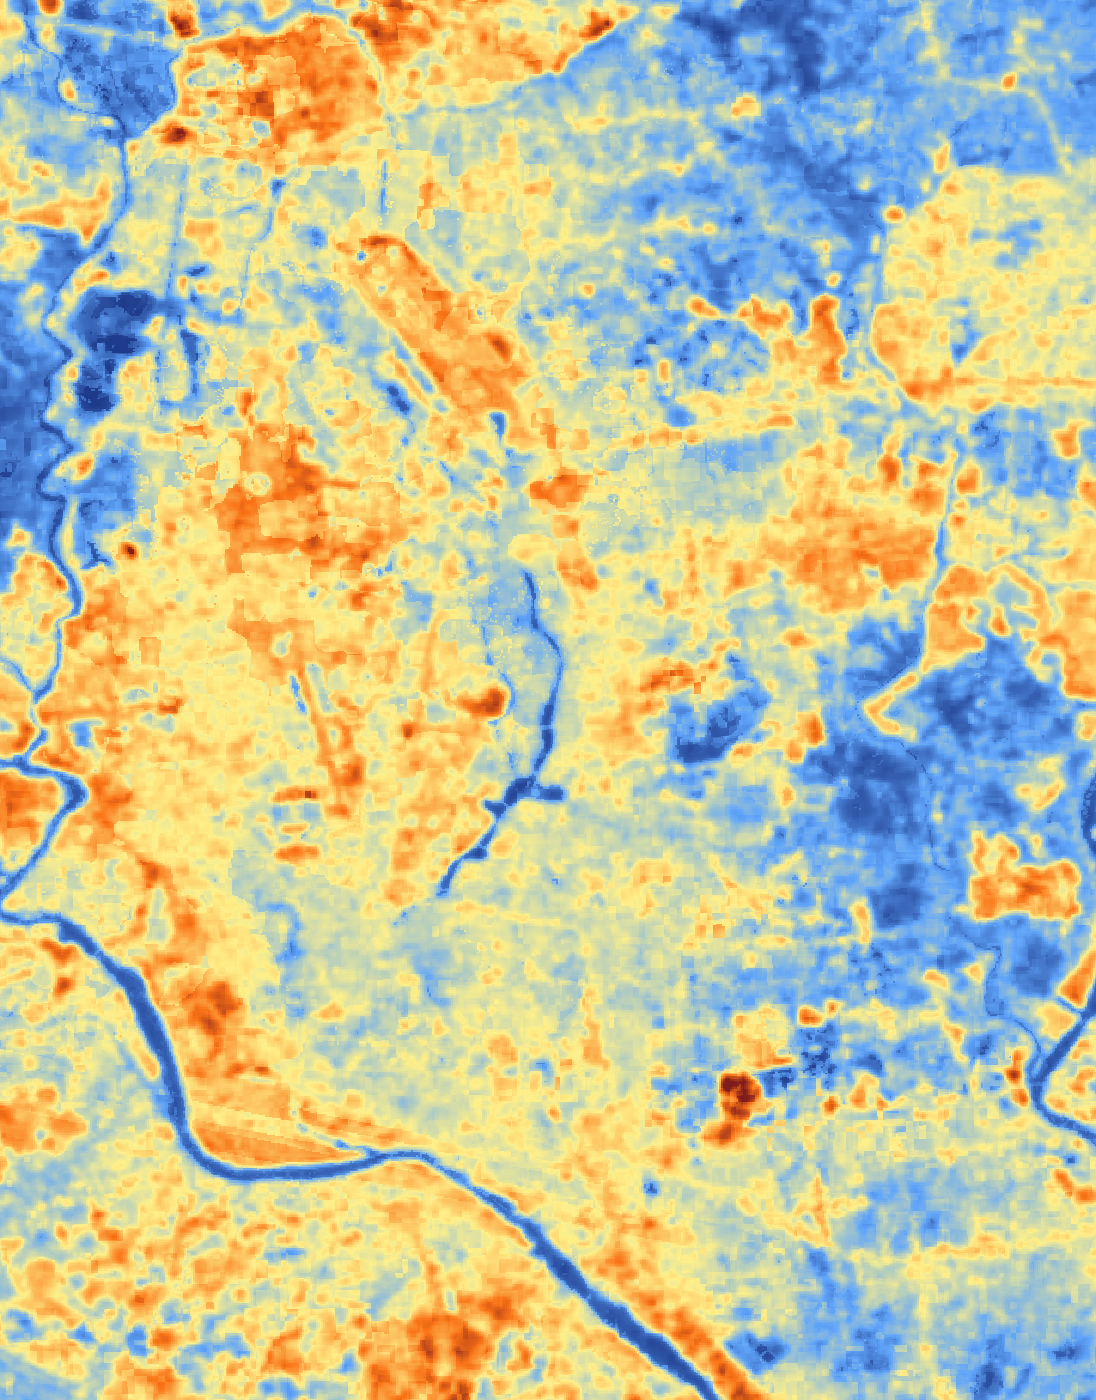
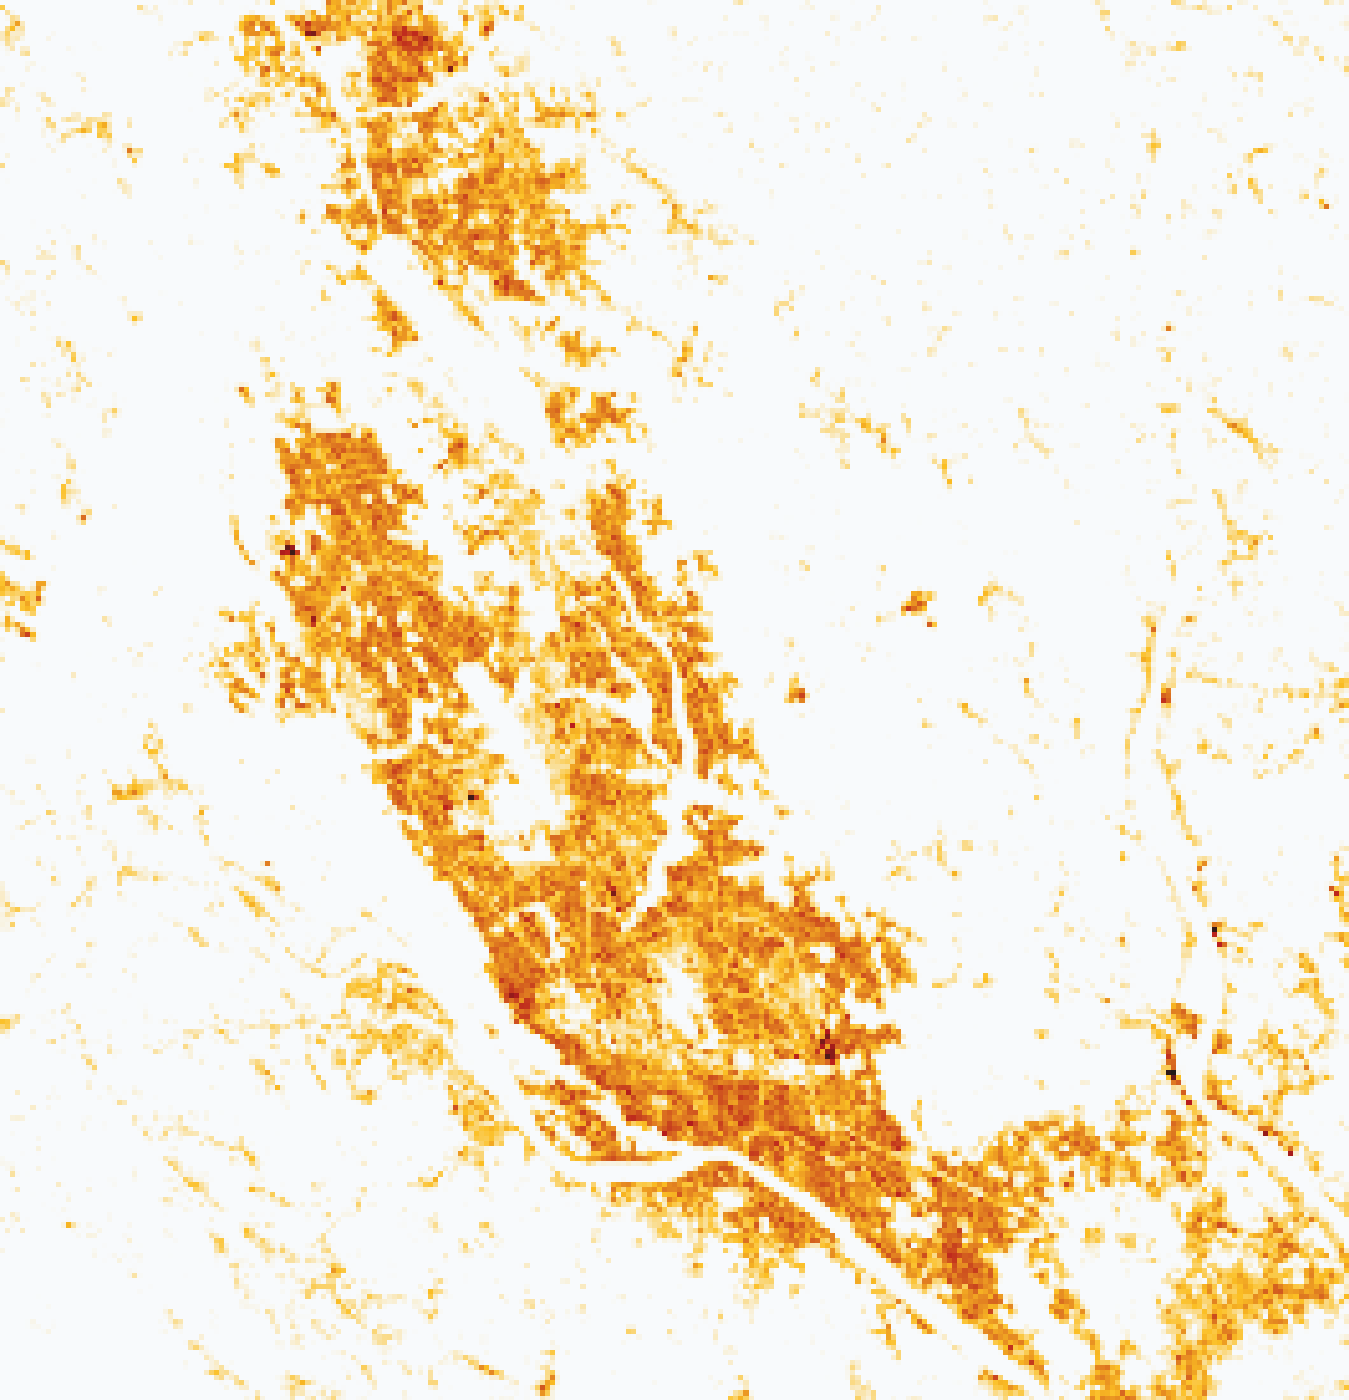
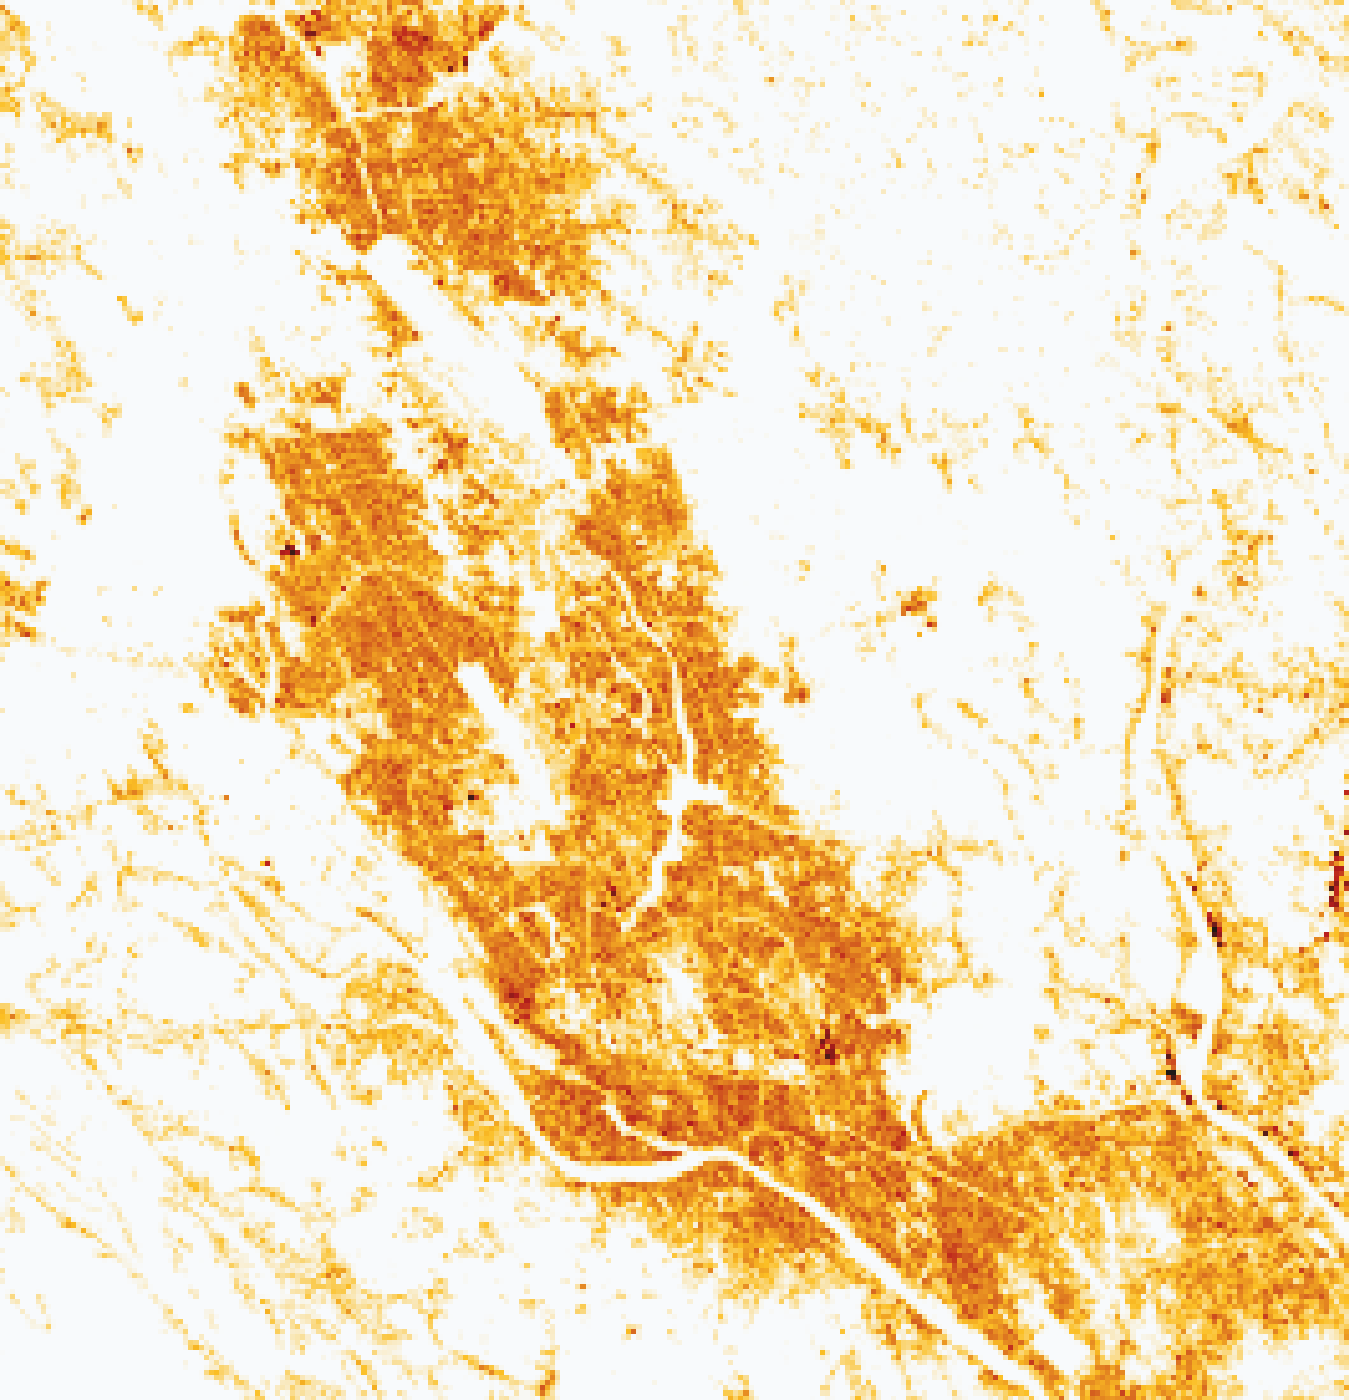
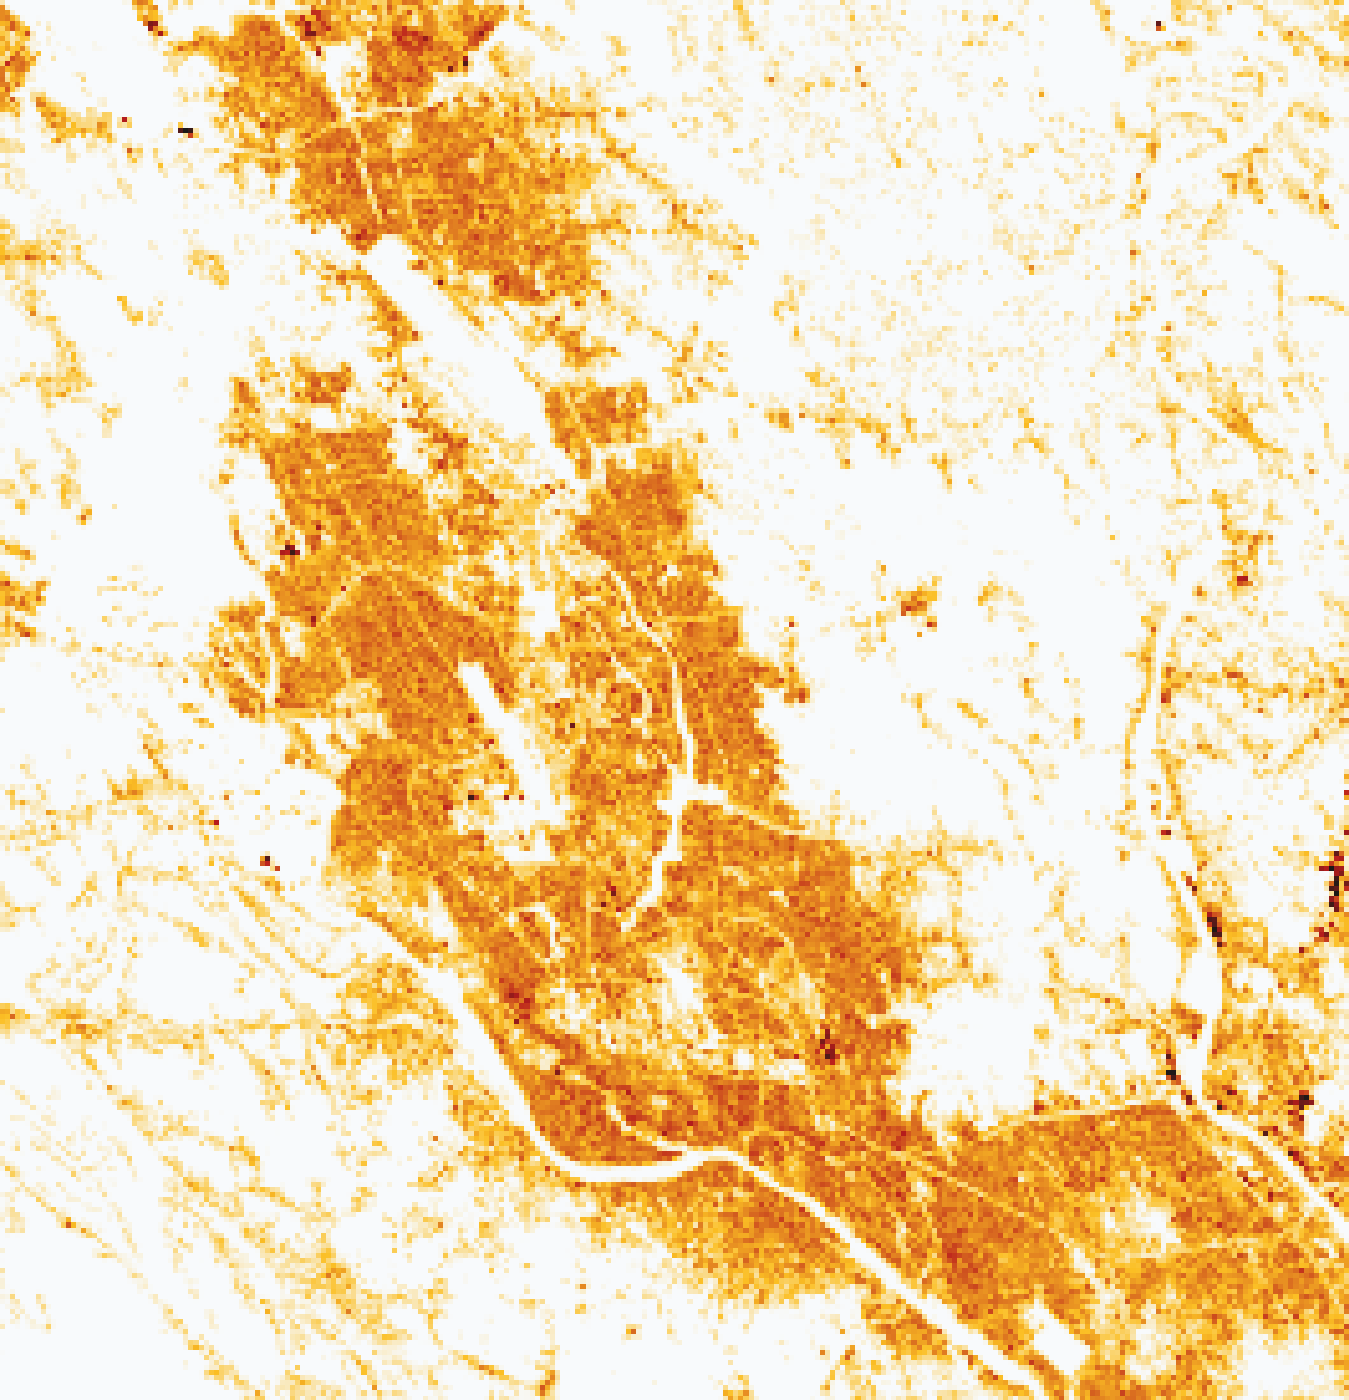
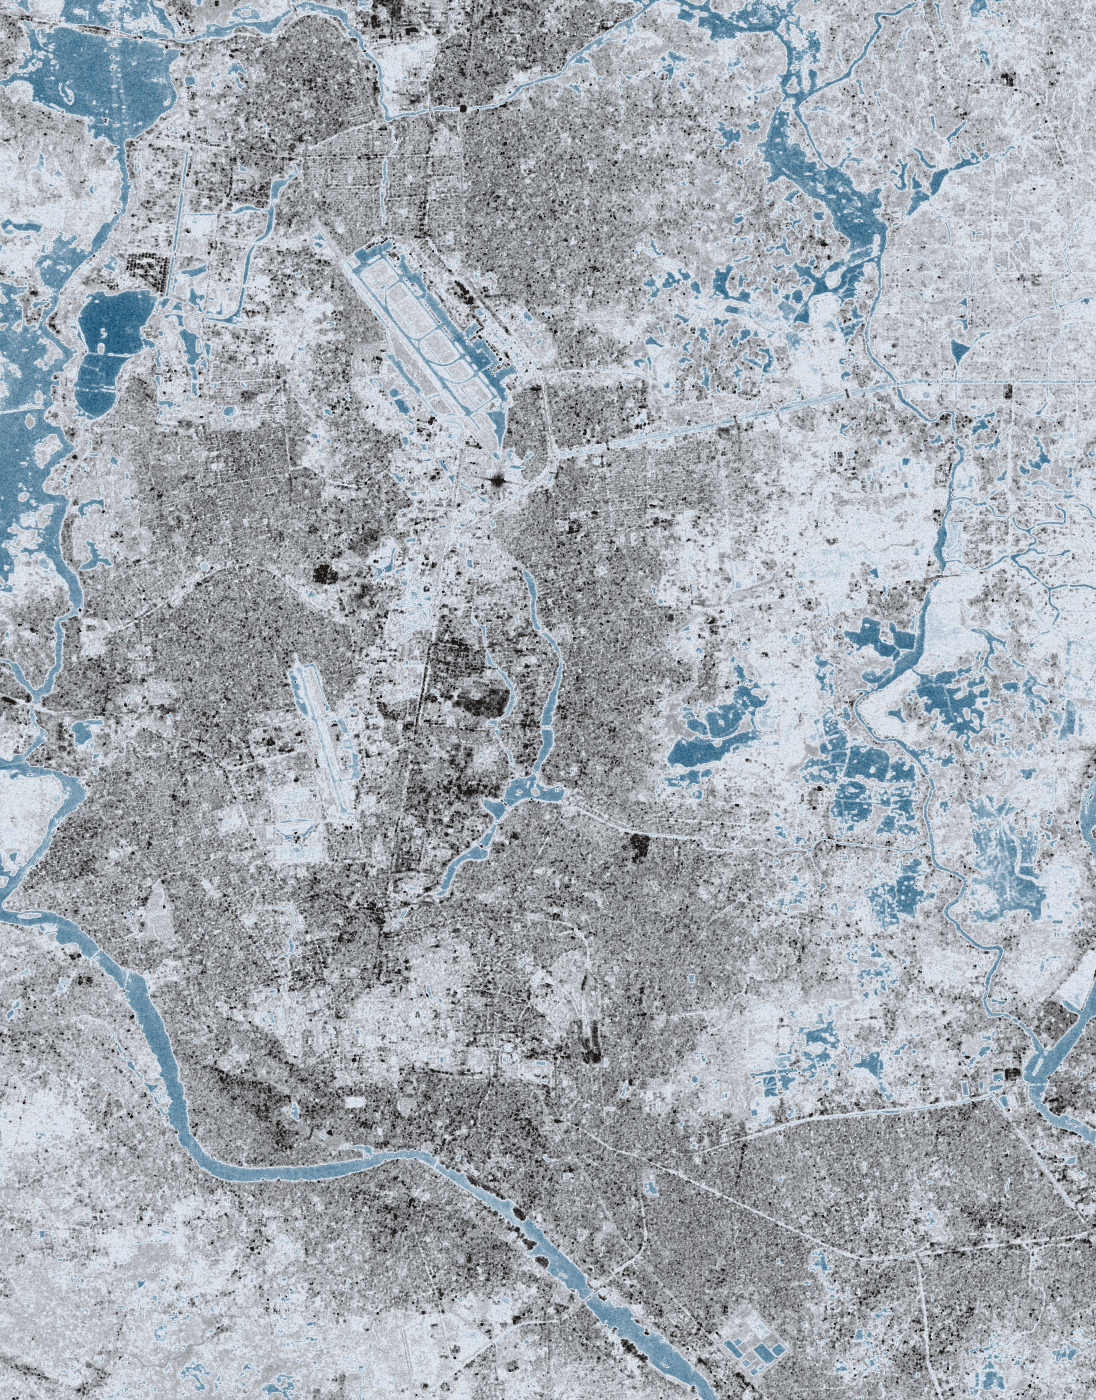
Forty-one thanas, latest year
One hue per map, light to dark. Hover a thana for its value. The thana outlines are the geoBoundaries ADM3 layer, a coarse trace at roughly 1 km, so edges are blocky and per-thana areas and densities are not reported; city totals use the official city-corporation polygons.
Decades of change, city-wide
Intensities are area-weighted means across the 41 thanas; counts are sums. Ranges follow each dataset's own start year.
Every thana ranked
What moves together
Each point is a thana. These are cross-sections, not causal estimates.
Built form and the economy
Table view
Latest year per column. Blank means the source has no value for that thana.
| Thana | Population 2022 | Night light | Surface temp °C | NDVI | Built % | Trees % | NO₂ µmol/m² | PM2.5 µg/m³ | Monsoon water % |
|---|---|---|---|---|---|---|---|---|---|
| Adabor | 310,502 | 24.8 | 33.6 | 0.21 | 99.7 | 0.3 | 165.1 | 74.8 | 0.0 |
| Badda | 1,012,416 | 19.6 | 33.8 | 0.34 | 70.8 | 8.2 | 162.2 | 75.8 | 5.1 |
| Bangshal | 173,800 | 20.7 | 33.2 | 0.17 | 91.4 | 0.0 | 182.3 | 74.9 | 0.1 |
| Biman Bandar | 22,935 | 26.4 | 33.0 | 0.32 | 41.1 | 13.0 | 171.5 | 73.4 | 9.0 |
| Cantonment | 142,268 | 21.6 | 32.4 | 0.37 | 76.5 | 10.8 | 171.6 | 74.7 | 1.8 |
| Chak Bazar | 236,017 | 18.3 | 33.3 | 0.19 | 81.0 | 1.5 | 179.5 | 75.2 | 2.0 |
| Dakshinkhan | 378,926 | 10.3 | 31.8 | 0.40 | 79.5 | 12.4 | 169.7 | 75.6 | 3.4 |
| Darus Salam | 220,632 | 21.7 | 33.0 | 0.24 | 76.0 | 4.6 | 156.8 | 73.0 | 6.2 |
| Demra | 354,332 | 11.9 | 30.8 | 0.37 | 67.3 | 11.0 | 178.0 | 77.1 | 5.3 |
| Dhanmondi | 179,670 | 31.0 | 32.1 | 0.24 | 89.8 | 2.6 | 177.6 | 75.5 | 0.2 |
| Gendaria | 129,183 | 22.5 | 34.2 | 0.18 | 98.6 | 0.1 | 177.9 | 73.8 | 0.0 |
| Gulshan | 329,114 | 34.0 | 32.7 | 0.27 | 86.6 | 2.8 | 172.3 | 74.1 | 3.2 |
| Hazaribagh | 267,860 | 17.3 | 33.7 | 0.24 | 93.1 | 4.3 | 164.2 | 76.8 | 1.0 |
| Jatrabari | 693,292 | 17.7 | 33.2 | 0.26 | 86.8 | 2.6 | 180.3 | 75.6 | 1.3 |
| Kadamtali | 541,800 | 15.4 | 33.0 | 0.24 | 83.6 | 3.3 | 177.7 | 76.1 | 5.9 |
| Kafrul | 531,916 | 22.7 | 33.2 | 0.28 | 85.9 | 3.6 | 174.2 | 74.2 | 1.1 |
| Kalabagan | 144,395 | 29.1 | 32.9 | 0.23 | 99.5 | 0.1 | 179.5 | 75.1 | 0.0 |
| Kamrangir Char | 55,268 | 10.3 | 34.1 | 0.19 | 85.4 | 0.1 | 157.9 | 75.5 | 10.6 |
| Khilgaon | 538,372 | 15.6 | 31.4 | 0.37 | 69.3 | 4.9 | 167.5 | 77.0 | 10.3 |
| Khilkhet | 245,557 | 18.7 | 32.5 | 0.39 | 62.2 | 13.6 | 158.1 | 75.5 | 3.9 |
| Kotwali | 57,720 | 16.2 | 33.3 | 0.18 | 76.6 | 0.0 | 179.3 | 74.8 | 0.4 |
| Lalbagh | 559,088 | 17.7 | 33.5 | 0.23 | 94.5 | 2.4 | 174.9 | 75.6 | 0.3 |
| Mirpur | 693,647 | 20.5 | 32.9 | 0.22 | 98.7 | 0.5 | 167.6 | 73.1 | 0.0 |
| Mohammadpur | 494,629 | 19.5 | 32.2 | 0.25 | 89.3 | 1.0 | 163.6 | 76.4 | 3.7 |
| Motijheel | 199,194 | 31.3 | 33.6 | 0.23 | 95.7 | 2.1 | 178.8 | 74.1 | 0.1 |
| New Market | 60,264 | 26.8 | 32.3 | 0.31 | 84.0 | 10.0 | 175.5 | 75.3 | 0.2 |
| Pallabi | 1,054,118 | 16.7 | 32.1 | 0.32 | 84.4 | 5.9 | 166.5 | 73.9 | 4.2 |
| Paltan | 56,571 | 33.2 | 33.3 | 0.23 | 95.8 | 0.0 | 180.9 | 74.5 | 0.0 |
| Ramna | 200,402 | 27.6 | 32.8 | 0.25 | 89.4 | 3.8 | 178.6 | 75.2 | 3.1 |
| Rampura | 368,156 | 22.1 | 32.7 | 0.22 | 87.7 | 0.3 | 175.3 | 74.7 | 6.2 |
| Sabujbagh | 475,181 | 15.8 | 31.7 | 0.34 | 81.6 | 13.0 | 178.7 | 74.9 | 0.3 |
| Shah Ali | 160,115 | 8.8 | 30.5 | 0.34 | 50.4 | 28.1 | 156.2 | 76.3 | 10.4 |
| Shahbagh | 67,947 | 41.4 | 32.6 | 0.31 | 84.0 | 12.3 | 182.9 | 75.1 | 0.1 |
| Sher-e-bangla Nagar | 276,023 | 32.7 | 32.4 | 0.30 | 76.5 | 11.5 | 178.9 | 75.2 | 0.4 |
| Shyampur | 268,901 | 14.8 | 34.5 | 0.19 | 86.8 | 1.4 | 173.0 | 74.5 | 6.9 |
| Sutrapur | 198,110 | 19.4 | 33.3 | 0.18 | 87.1 | 0.2 | 179.2 | 74.1 | 0.9 |
| Tejgaon | 136,929 | 33.3 | 33.8 | 0.30 | 83.7 | 9.6 | 181.2 | 75.1 | 0.2 |
| Tejgaon Ind. Area | 135,518 | 36.7 | 34.7 | 0.23 | 95.1 | 0.2 | 181.9 | 74.9 | 1.5 |
| Turag | 278,024 | 14.3 | 31.5 | 0.37 | 69.7 | 5.8 | 174.4 | 75.3 | 12.8 |
| Uttar Khan | 116,877 | 6.2 | 30.9 | 0.51 | 54.3 | 21.0 | 158.2 | 78.2 | 11.9 |
| Uttara | 266,373 | 24.2 | 32.2 | 0.25 | 96.1 | 1.0 | 178.1 | 73.3 | 0.2 |
Sources and method
| Variable | Source | Unit | Years |
|---|---|---|---|
| Aerosol optical depth at 550 nm | MODIS MCD19A2 v6.1 AOD 550 nm, annual mean | AOD | 2003–2025 |
| dw_bare_pct | Google Dynamic World V1, annual mode of label | % of thana area | 2016–2025 |
| Built-up land cover share | Google Dynamic World V1, annual mode of label | % of thana area | 2016–2025 |
| Cropland share | Google Dynamic World V1, annual mode of label | % of thana area | 2016–2025 |
| dw_flooded_vegetation_pct | Google Dynamic World V1, annual mode of label | % of thana area | 2016–2025 |
| dw_grass_pct | Google Dynamic World V1, annual mode of label | % of thana area | 2016–2025 |
| dw_shrub_and_scrub_pct | Google Dynamic World V1, annual mode of label | % of thana area | 2016–2025 |
| dw_snow_and_ice_pct | Google Dynamic World V1, annual mode of label | % of thana area | 2016–2025 |
| Tree cover share | Google Dynamic World V1, annual mode of label | % of thana area | 2016–2025 |
| Water share (Dynamic World) | Google Dynamic World V1, annual mode of label | % of thana area | 2016–2025 |
| Built-up surface | JRC GHSL P2023A GHS_BUILT_S 100 m, sum of built surface | m2 | 1975–2030 |
| Population (GHSL model) | JRC GHSL P2023A GHS_POP 100 m, sum | persons | 1975–2030 |
| Surface temperature at 30 m, Mar–May median | Landsat 8/9 C2 L2 ST_B10, Mar-May median, cloud/shadow masked | deg C | 2013–2026 |
| Day land surface temperature, annual mean | MODIS MOD11A2 v6.1 day LST, annual mean | deg C | 2000–2025 |
| Night land surface temperature, annual mean | MODIS MOD11A2 v6.1 night LST, annual mean | deg C | 2000–2025 |
| Day land surface temperature, Mar–May | MODIS MOD11A2 v6.1 day LST, Mar-May mean | deg C | 2000–2025 |
| Vegetation index (NDVI), annual mean | MODIS MOD13A1 v6.1 NDVI, annual mean | index | 2000–2025 |
| Night-time light radiance | NOAA VIIRS DNB monthly VCMSLCFG, annual mean | nW/cm2/sr | 2014–2025 |
| Tropospheric NO₂ column, annual mean | Sentinel-5P OFFL L3 tropospheric NO2, annual mean | umol/m2 | 2019–2025 |
| Satellite-derived PM2.5 | ACAG V6 (V6GL02) satellite-derived PM2.5, sat-io mirror, annual | ug/m3 | 1998–2022 |
| Annual precipitation | CHIRPS daily, annual sum | mm | 1981–2025 |
| Open water in monsoon (radar), Jul–Sep | Sentinel-1 GRD IW VV Jul-Sep median < -16 dB | % of thana area | 2015–2025 |
| Air temperature at 2 m, annual mean | ERA5-Land monthly 2 m temperature, annual mean | deg C | 1980–2025 |
| Permanent surface water | JRC Global Surface Water v1.4 yearly history | % of thana area | 1984–2021 |
| Seasonal surface water | JRC Global Surface Water v1.4 yearly history | % of thana area | 1984–2021 |
| Population (WorldPop model) | WorldPop GP 100 m unconstrained, sum | persons | 2000–2020 |
| Population 2022 | OCHA COD-PS Bangladesh ADM3 (BBS Census 2022 projection), via HDX | persons | 2022 |
| Relative Wealth Index | Meta Data for Good, 2.4 km grid, via HDX; thana mean of grid points; thanas whose name is shared with another district are left blank | index | 2021 |
| Persons engaged by sector | BBS Economic Census 2013, city-corporation tables | persons | 2013 |
| Thana boundaries | geoBoundaries ADM3 via HDX; the 41 features whose extent lies inside 90.30–90.55 E, 23.64–23.93 N; coarse ~1 km trace, zonal units only | polygon | 2023 |
| City-corporation boundaries | OCHA COD-AB Bangladesh ADM3 (BBS) via HDX: Dhaka North (BD30262500) and Dhaka South (BD30262000); used for land area, density and the Planet clip polygon | polygon | downloaded 2026-01 |
Method: polygons are reduced in Google Earth Engine at each dataset's native scale (Landsat 30 m, Sentinel-1 20 m, Dynamic World 10 m, MODIS 500 m or 1 km, Sentinel-5P 7 km, ERA5-Land 11 km). Coarse products are reported per thana for continuity, but neighbouring small thanas share pixels at 1 km and above; read those maps at the district scale. Landsat surface temperature uses the Collection 2 Level 2 scale factor (0.00341802 × DN + 149 K) with cloud, shadow and dilated-cloud pixels masked by QA_PIXEL. Sentinel-1 open water is VV backscatter below -16 dB in the July–September median. GHSL 2025 and 2030 epochs are model projections by the JRC, not observations. Planet Labs 3 m imagery for the same polygon is on an Education and Research licence (3,000 km² a month, 30-day delay) and will be added as a separate layer.
Page built 2026-09-26.